
Download Yob - Graph Editor – Chrome Apps, Google Docs, Google Drive, Graphing Tool
Overview
Yob - Graph Editor is a desktop application designed to streamline data visualization and analysis within educational environments. Built specifically for classroom use, it integrates directly with Google Docs and Google Drive, enabling seamless creation and management of graphs and regression models during document editing. The software allows users to plot data, perform regression analysis, and insert visualizations into documents with minimal effort. This makes it particularly valuable for both students and teachers who need to present data-driven insights in academic reports, lesson plans, or assignments.
By combining graphing capabilities with real-time document integration, Yob reduces the need for switching between applications, enhancing workflow efficiency. Its design supports quick data plotting for basic use cases while also offering advanced tools like calculated columns and non-linear curve fitting for more complex analysis. The tool is ideal for educators creating visual aids and students completing science or math projects. While the developer has not provided additional background information, the software’s focus on collaboration and integration with cloud-based platforms suggests a strong emphasis on accessibility and ease of use in academic settings.
Key Features & Capabilities
- Real-time Graph Integration – Graphs can be created and inserted directly into Google Docs with a single click, allowing users to embed visualizations without leaving their document.
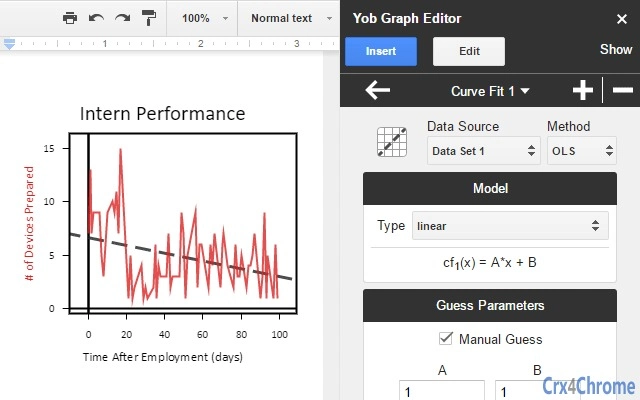
- Regression Analysis Tools – Supports various regression models, including linear and non-linear curve fitting, enabling users to analyze trends and predict outcomes from data sets.
- Calculated Columns – Users can generate derived data within the tool, simplifying preprocessing and enhancing analytical depth without external software.
- Cloud-Based Data Transfer – Leverages Google Drive to store and transfer graphs and associated data between documents and devices, ensuring continuity across sessions.
- Easy Editing and Updates – Graphs can be modified at any time after insertion, allowing for dynamic updates to data or visual style without re-creating the entire chart.
These features are particularly effective in academic workflows where accuracy, clarity, and collaboration are essential. For example, a teacher can create a scatter plot in a lesson plan, add a trendline, and share it with students via a shared document. A student can then modify the data, observe how the graph changes, and submit an updated version. The ability to copy and paste graphs across documents ensures that visual content remains consistent and reusable.
User Interface, Workflow & Performance
The user interface of Yob - Graph Editor is designed for simplicity and efficiency, aligning with the expectations of educational users. The layout emphasizes accessibility, with core functions such as data input, graph creation, and editing located within a clean, intuitive dashboard. Navigation is straightforward, allowing users to switch between data entry, visualization, and analysis modes with minimal clicks.
Workflow efficiency is enhanced by the tight integration with Google Docs and Google Drive, reducing the friction typically associated with data visualization tasks. Users can begin plotting data immediately after launching the application, and the tool maintains responsiveness during standard operations. However, exact performance details were not specified by the developer, and resource usage such as CPU or RAM consumption remains unconfirmed. General software behavior patterns suggest stable operation under typical conditions, but users should monitor system performance during prolonged use. The application appears to be lightweight, given its 10 MB size, which supports smooth startup and operation across different devices.
Compatibility & System Requirements
Yob - Graph Editor is compatible with Windows, Mac, and Linux operating systems, making it accessible to a broad range of users across different computing environments. The software has a compact installation size of 10 MB, indicating a lightweight footprint that should not strain system resources. It is designed to function as a desktop application that works in conjunction with web browsers, specifically supporting Google Chrome and Firefox.
While the software version is listed as 1.0, detailed system requirements such as minimum processor speed, RAM, or storage space were not provided. The developer did not specify whether additional browser extensions or plugins are required for full functionality. Platform compatibility information is limited to the supported OS and browser types, with no mention of touchscreen support or accessibility features. Users are advised to ensure their system meets general requirements for running modern web-based applications and their respective browsers.
Pros and Cons
Pros
- Seamless integration with Google Docs and Google Drive for easy document-based data visualization.
- Supports both basic and advanced analytical features, including regression and calculated columns.
- Lightweight design with a small installation size of 10 MB.
- Free to download and use, making it accessible for students and educators.
- Allows for easy editing and updating of graphs after insertion into documents.
Cons
- Browser dependency on Chrome and Firefox; no support for other browsers.
- Exact system requirements were not listed, which may affect installation on older or low-end systems.
- Limited to cloud-based workflows, which may pose challenges in offline environments.
- Developer background and company details were not provided.
- No information available on update frequency or long-term support plans.
FAQ Section
Is Yob compatible with all web browsers?
Yob currently supports only Google Chrome and Firefox. Users are advised to use one of these browsers to ensure full functionality.
Can I use Yob without an internet connection?
While the application integrates with Google Drive, offline usage may be limited. The tool relies on cloud services for data storage and transfer, so consistent internet access is recommended for optimal performance.
Is Yob free to use?
Yes, Yob is available at no cost. There are no subscription fees or in-app purchases reported.
What kind of data can I plot in Yob?
Users can input various types of numerical data for plotting. The software supports calculated columns and advanced regression models, allowing for diverse data visualization needs.
How do I update Yob?
Update mechanisms were not specified by the developer. Users should check the official website or documentation for the latest version and update instructions.
Final Thoughts + CTA
Yob - Graph Editor stands out as a practical, education-focused tool that bridges the gap between data analysis and document creation. Its ability to integrate graphs directly into Google Docs, combined with regression analysis and calculated columns, makes it a versatile asset for classroom environments. The lightweight design and free access further enhance its appeal for students and teachers alike.
While some limitations exist—such as browser restrictions and incomplete system requirement details—the software delivers a focused, efficient experience tailored to academic use. For anyone working in education who needs to visualize data within documents, Yob offers a streamlined solution that reduces complexity without sacrificing functionality.
Download Yob - Graph Editor now to enhance your data presentation and analysis workflow in the classroom.